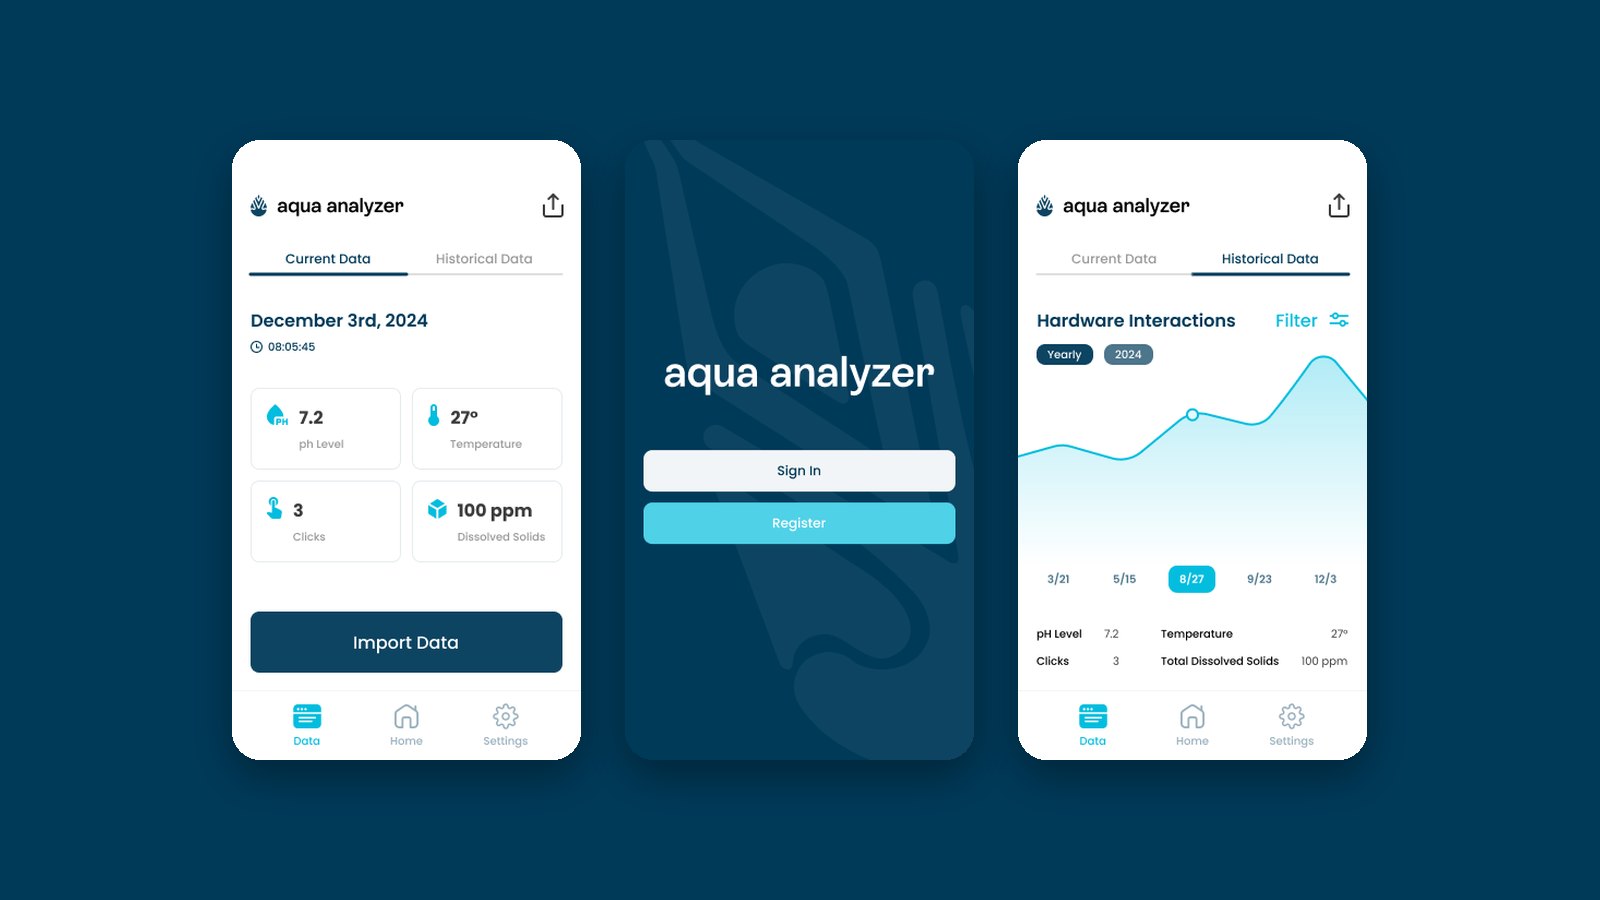
Aqua Analyzer is a low-cost water quality testing device that Enactus SFU was developing, designed to measure pH, total dissolved solids, turbidity and temperature. The plan was for profits to fund the device for Indigenous communities.
I designed the concept and prototype for its companion app.
The Brief
The hardware team needed a simple way to get readings off the device and keep a record of them. The app had to work offline, since it was meant to be used in the field and in communities without reliable internet.
I worked from the engineering team’s requirements: connect to the device over Bluetooth, pull in a reading with one tap, keep every reading as history, and export it all as a CSV for analysis.
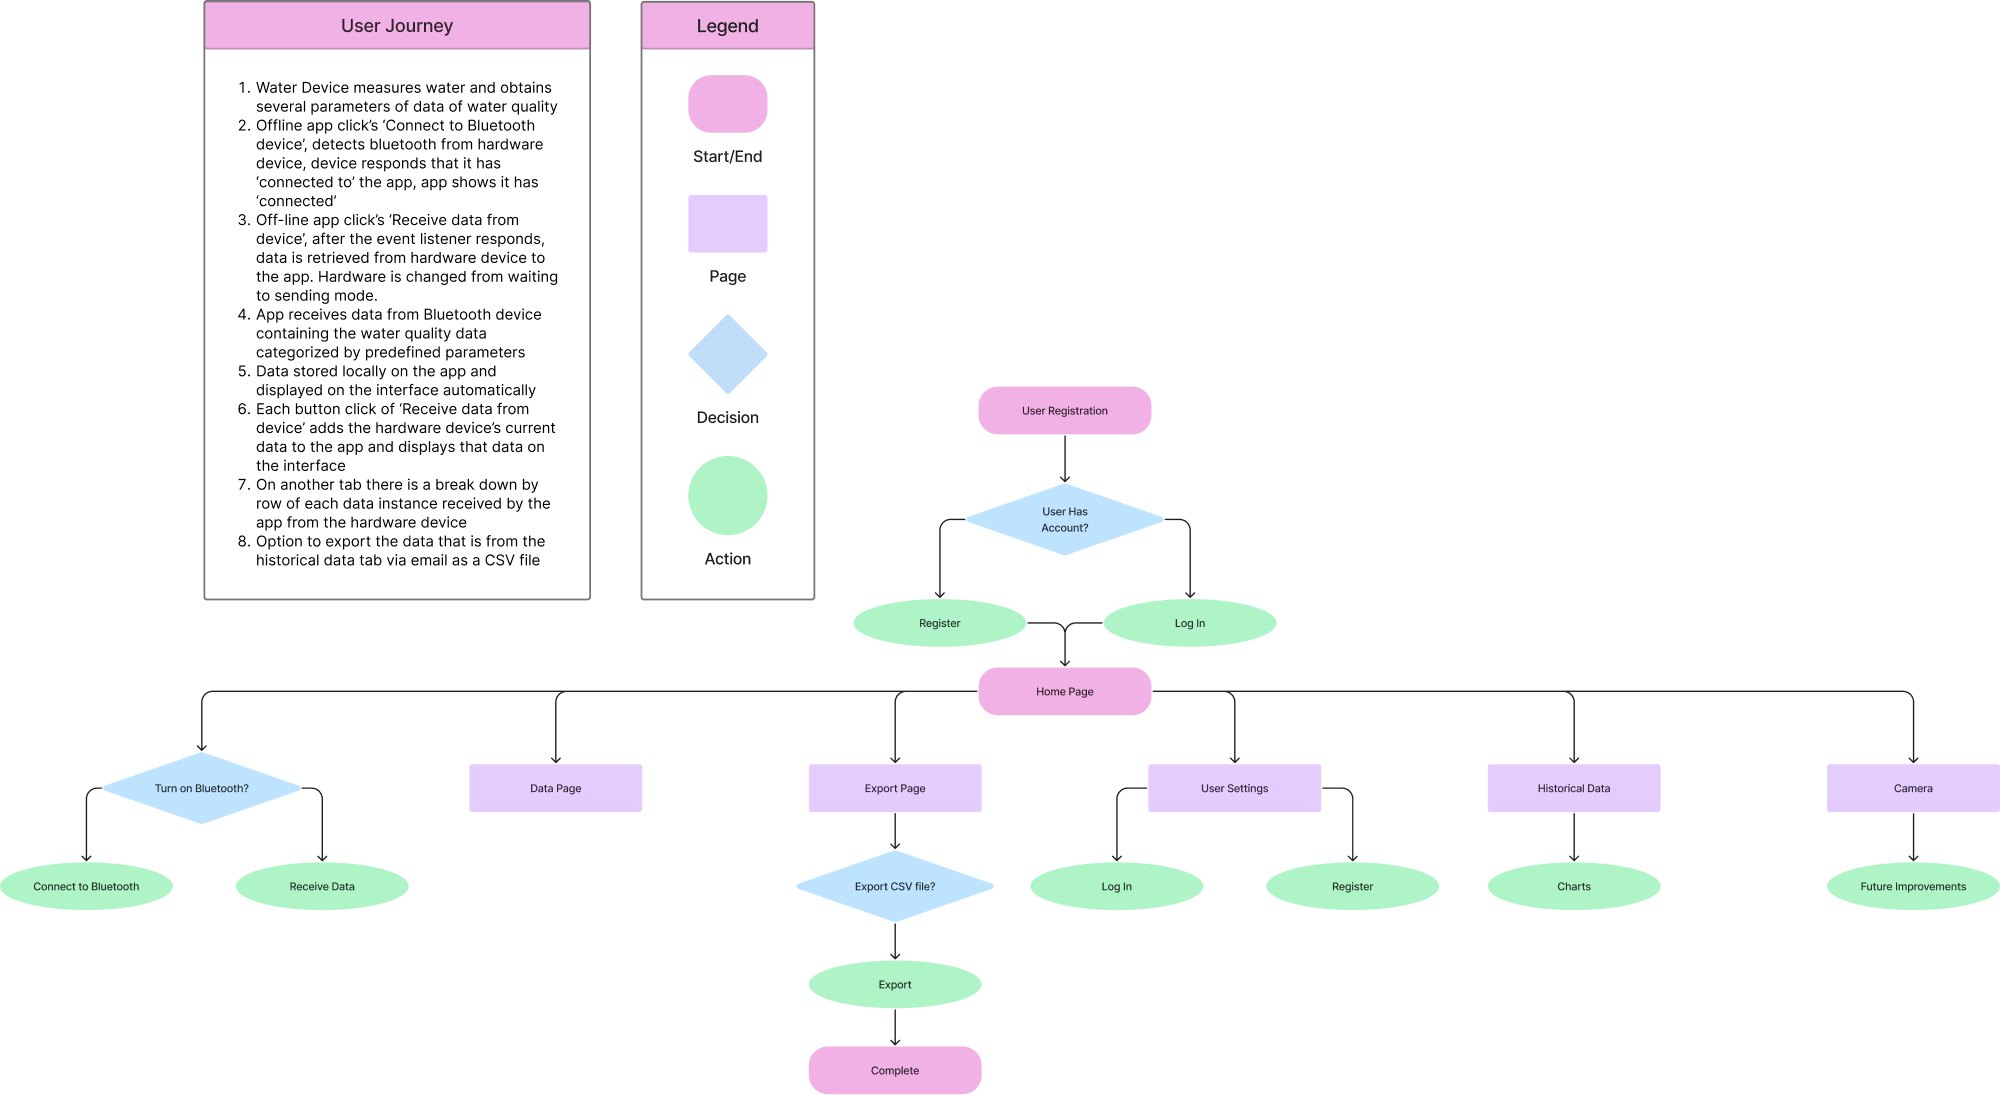
User Flow
I mapped the full journey first, from signing in and connecting the device to receiving data, browsing history and exporting. Writing it out step by step made clear which screens the app actually needed, and which decisions the user makes along the way.
Wireframes
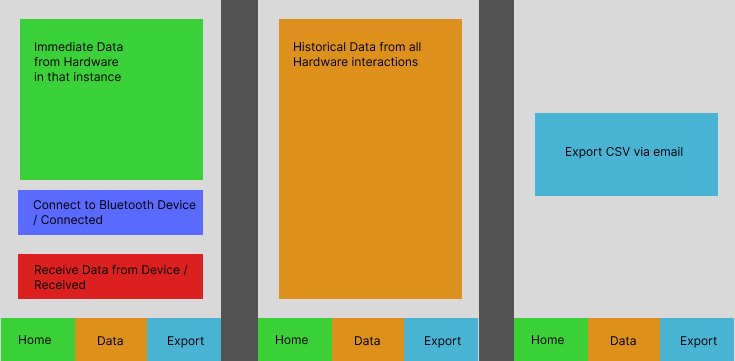
Low-fidelity wireframes split the app into three jobs: the reading in front of you, every reading so far, and export. Mid-fidelity wireframes added sign in, settings and a chart of past readings, which I reviewed with the engineering team to confirm what data to show and how history would be saved.

Final Prototype
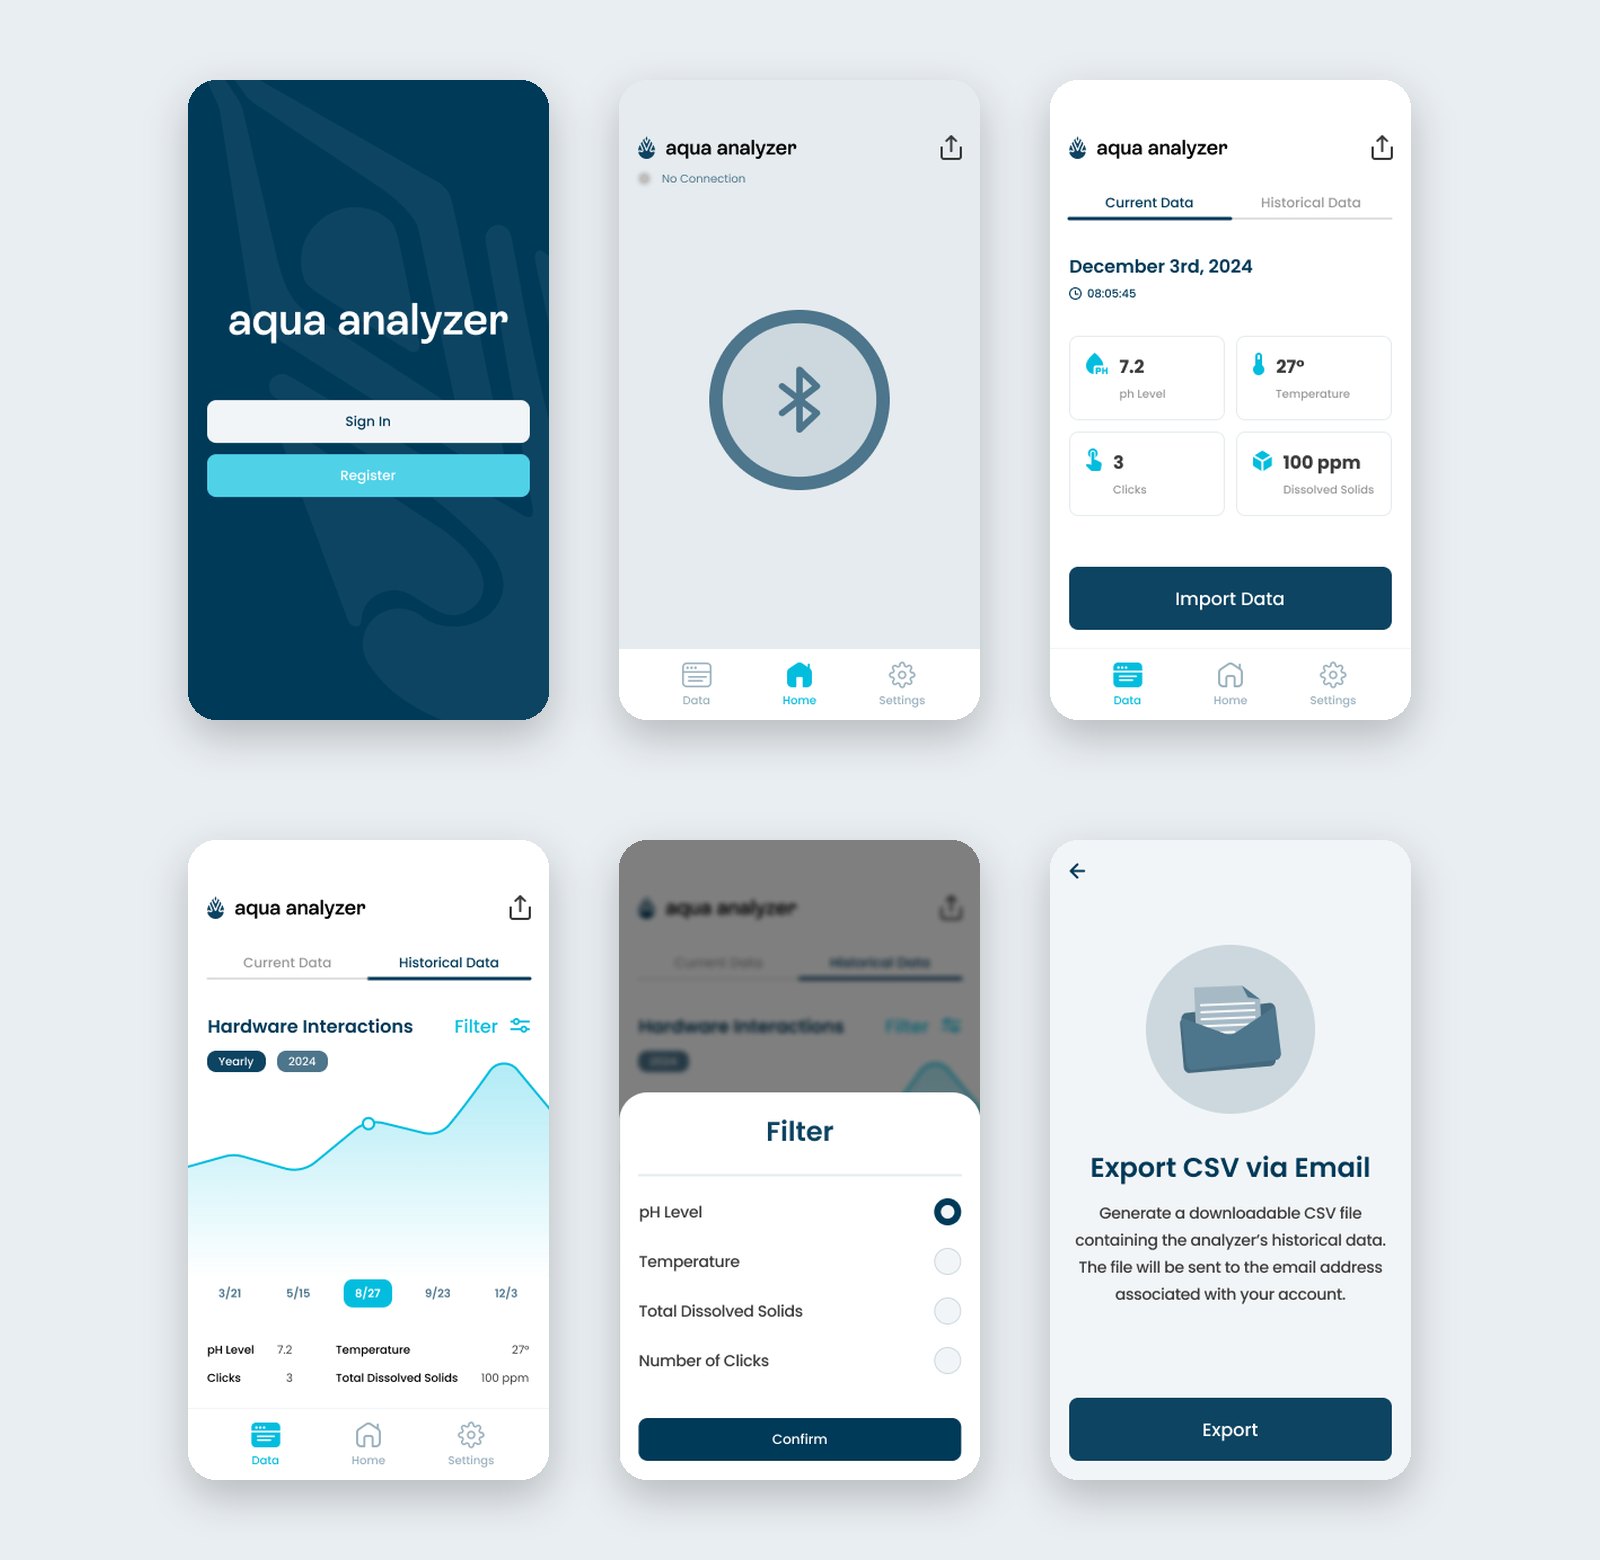
The final app centres on one big Bluetooth button to connect the device. Readings show as four clear cards with today’s date and time, and the history tab charts every reading, filterable by pH, temperature, dissolved solids or number of readings. Export sends the full history to the user’s email as a CSV.
I built the screens on a shared component library and handed them off to the developers, clarifying interaction behaviour as they implemented it.
Key Learnings
- Design for what the team can build. Our developers were students with limited time and experience, so I kept the app to a small set of simple, reusable screens rather than designing features they couldn’t realistically ship.
- A design only matters if it survives hand-off. Clear specs, consistent components and staying available to answer questions during development did as much for the final product as the screens themselves.
This is just a snapshot of the design process.
Reach out to jaylee2402@gmail.com for the full story.
Next

AIGA Lens Symposium
Microsite · Visual Identity · 2023