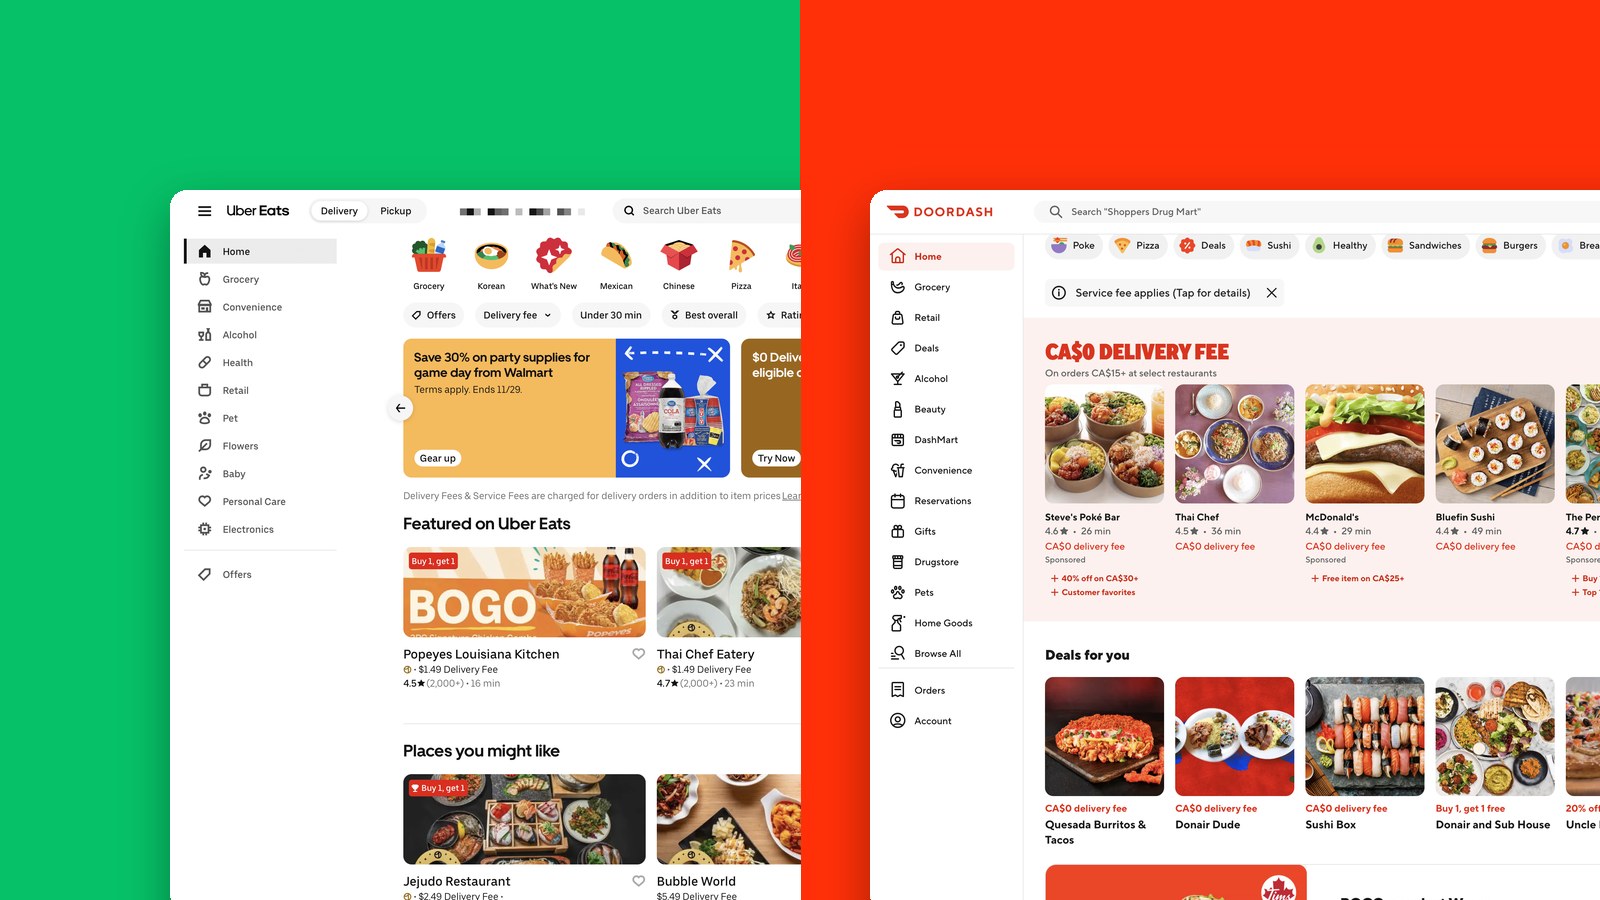
A controlled study comparing how quickly people complete five everyday tasks on the Uber Eats and DoorDash websites, two of the most used food delivery apps in Canada.
The Question
Our hypothesis was that Uber Eats would lead to faster task completion than DoorDash overall. The null hypothesis was that there would be no difference.
Study Design
Five students aged 19 to 21 each completed the same five tasks on both websites, in a within-subjects design. To reduce learning effects, we alternated which site came first: three started on Uber Eats and two on DoorDash.
Every session ran in the same room, on the same laptop, with both accounts logged in and the same starting address. Our team split into facilitator, timer and note-taker. We timed each task from the first touch of the trackpad to reaching the target screen, and also recorded errors and task success. After each site, participants rated every task with the Single Ease Question and filled in the System Usability Scale and an adapted NASA-TLX.
- Find a specific restaurant, add a dish to the cart, and go to checkout.
- Find the highest-rated Mexican restaurant that delivers in under 30 minutes.
- Build an order under $25, including fees, and go to checkout.
- Find a Buy One Get One deal, add it to the cart, and go to checkout.
- Change the delivery address.
I was the facilitator, the one speaking with participants directly: welcoming them, giving each task and walking them through the questionnaires, while my teammates handled timing and notes.
Results
Participants were faster on Uber Eats on average for every task, but a paired-samples t-test found only one significant difference. On Task 2, every participant finished faster on Uber Eats (M = 59.8s, SD = 25.98) than on DoorDash (M = 126.2s, SD = 28.9), p = .009.
Tasks 1, 3, 4 and 5 all had p-values above .05, so our hypothesis wasn’t supported and we failed to reject the null hypothesis. One significant task tells us about one feature, not the whole interface.
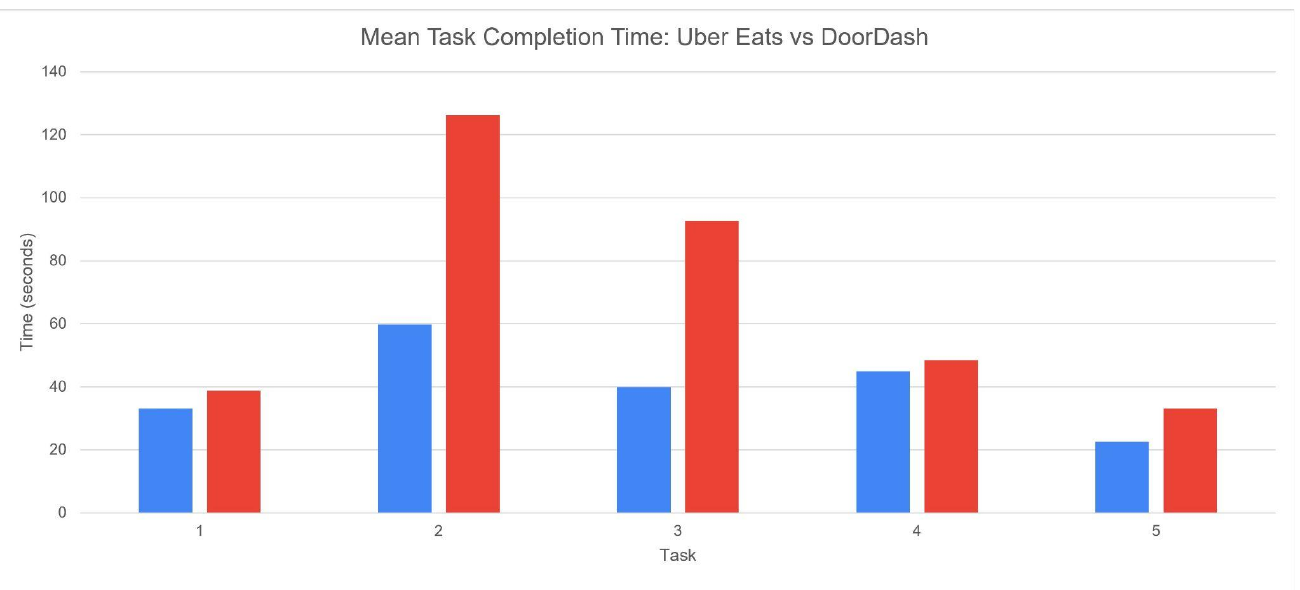
Why Task 2?
The likely reason is wording. Uber Eats has an “Under 30 min” filter that matches the task word for word, while DoorDash only offers “Fastest”, which is close but not the same. Uber Eats may also have simply had more restaurants that fit, and the task asked for several criteria at once.
Both sites also struggled with relevance. Searching for Mexican food returned liquor stores, grocery stores and even a go-kart track, which slowed every participant down on both platforms.
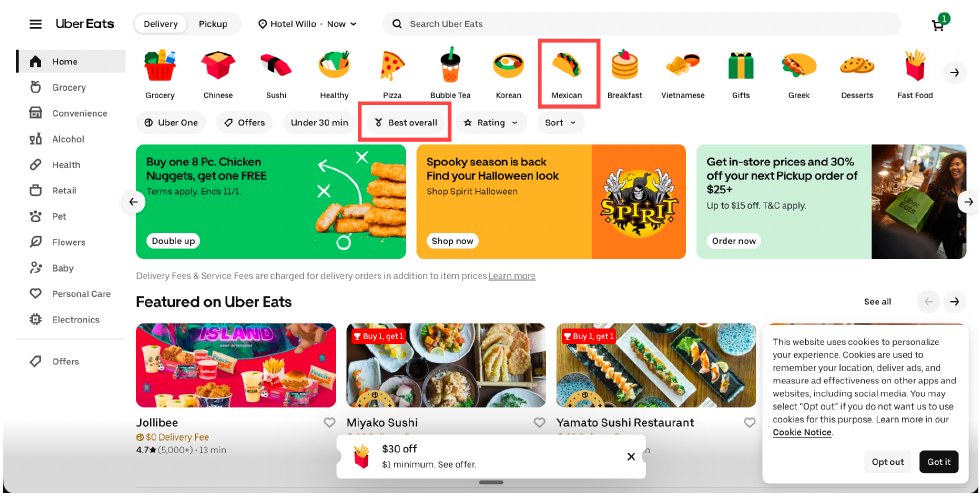
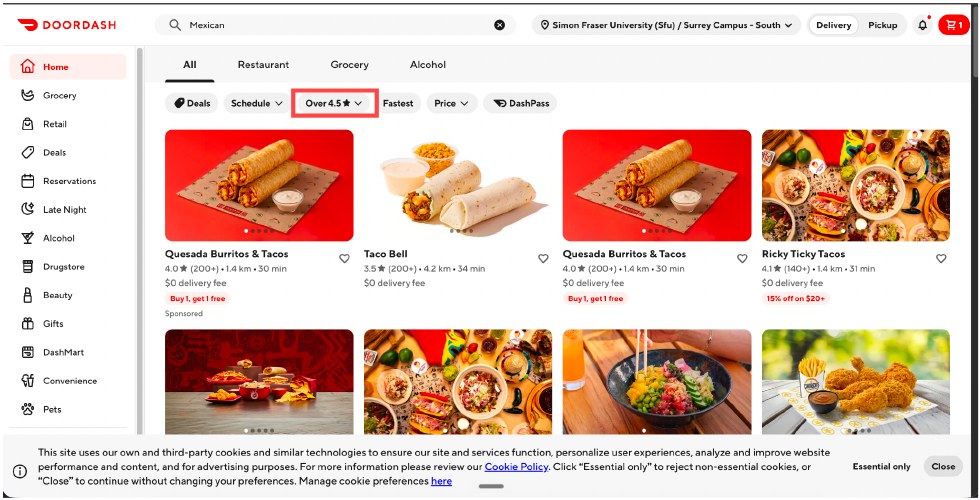
Uber Eats’ “Under 30 min” filter, lefttop, versus DoorDash’s “Fastest”, rightbottom.
Key Learnings
- Match the words people already have in mind. A label like “Under 30 min” is easier to recognize than a vaguer one like “Fastest”.
- Control everything you can. Unstable Wi-Fi, an unbalanced site order, leftover search history and reused accounts all added noise. Next time I’d use fresh accounts, a stable connection, and a clear definition of what counts as an error before the first session.
- Test where people actually use it. Most participants order on their phones, but we tested the laptop websites with five students, so the results may not carry over to the apps or to a wider group.
This is just a snapshot of the research process.
Reach out to jaylee2402@gmail.com for the full story.
Next

Token Studios Inc.
UX Research · Interaction Design · 2025